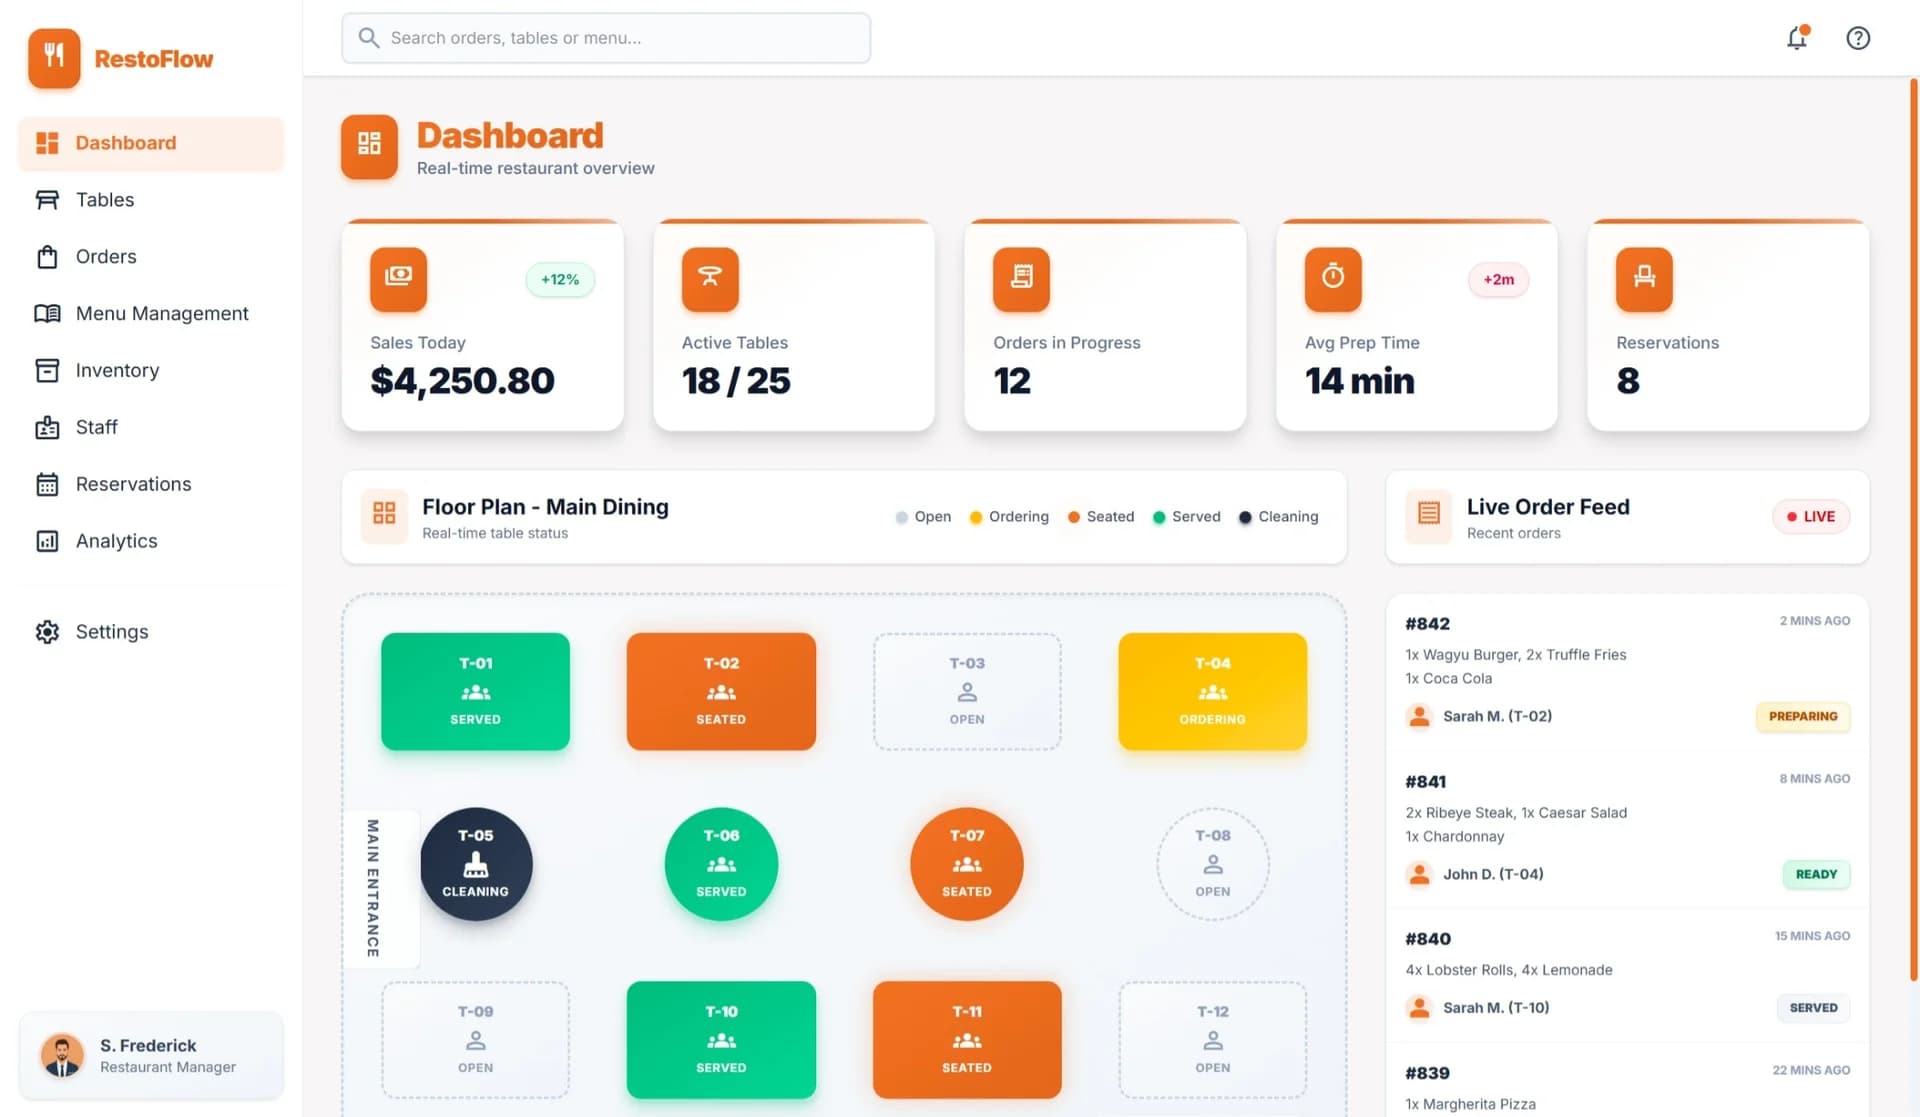
From OrderTo InsightIn Real-Time
An enterprise-grade digital ordering and operations platform that orchestrates the entire guest journey from reservation to payment across 40+ restaurant locations.

The case in one scan.
A fast read on the operational context, engineering scope, and measured business value before the deeper story begins.
Context-specific workflows
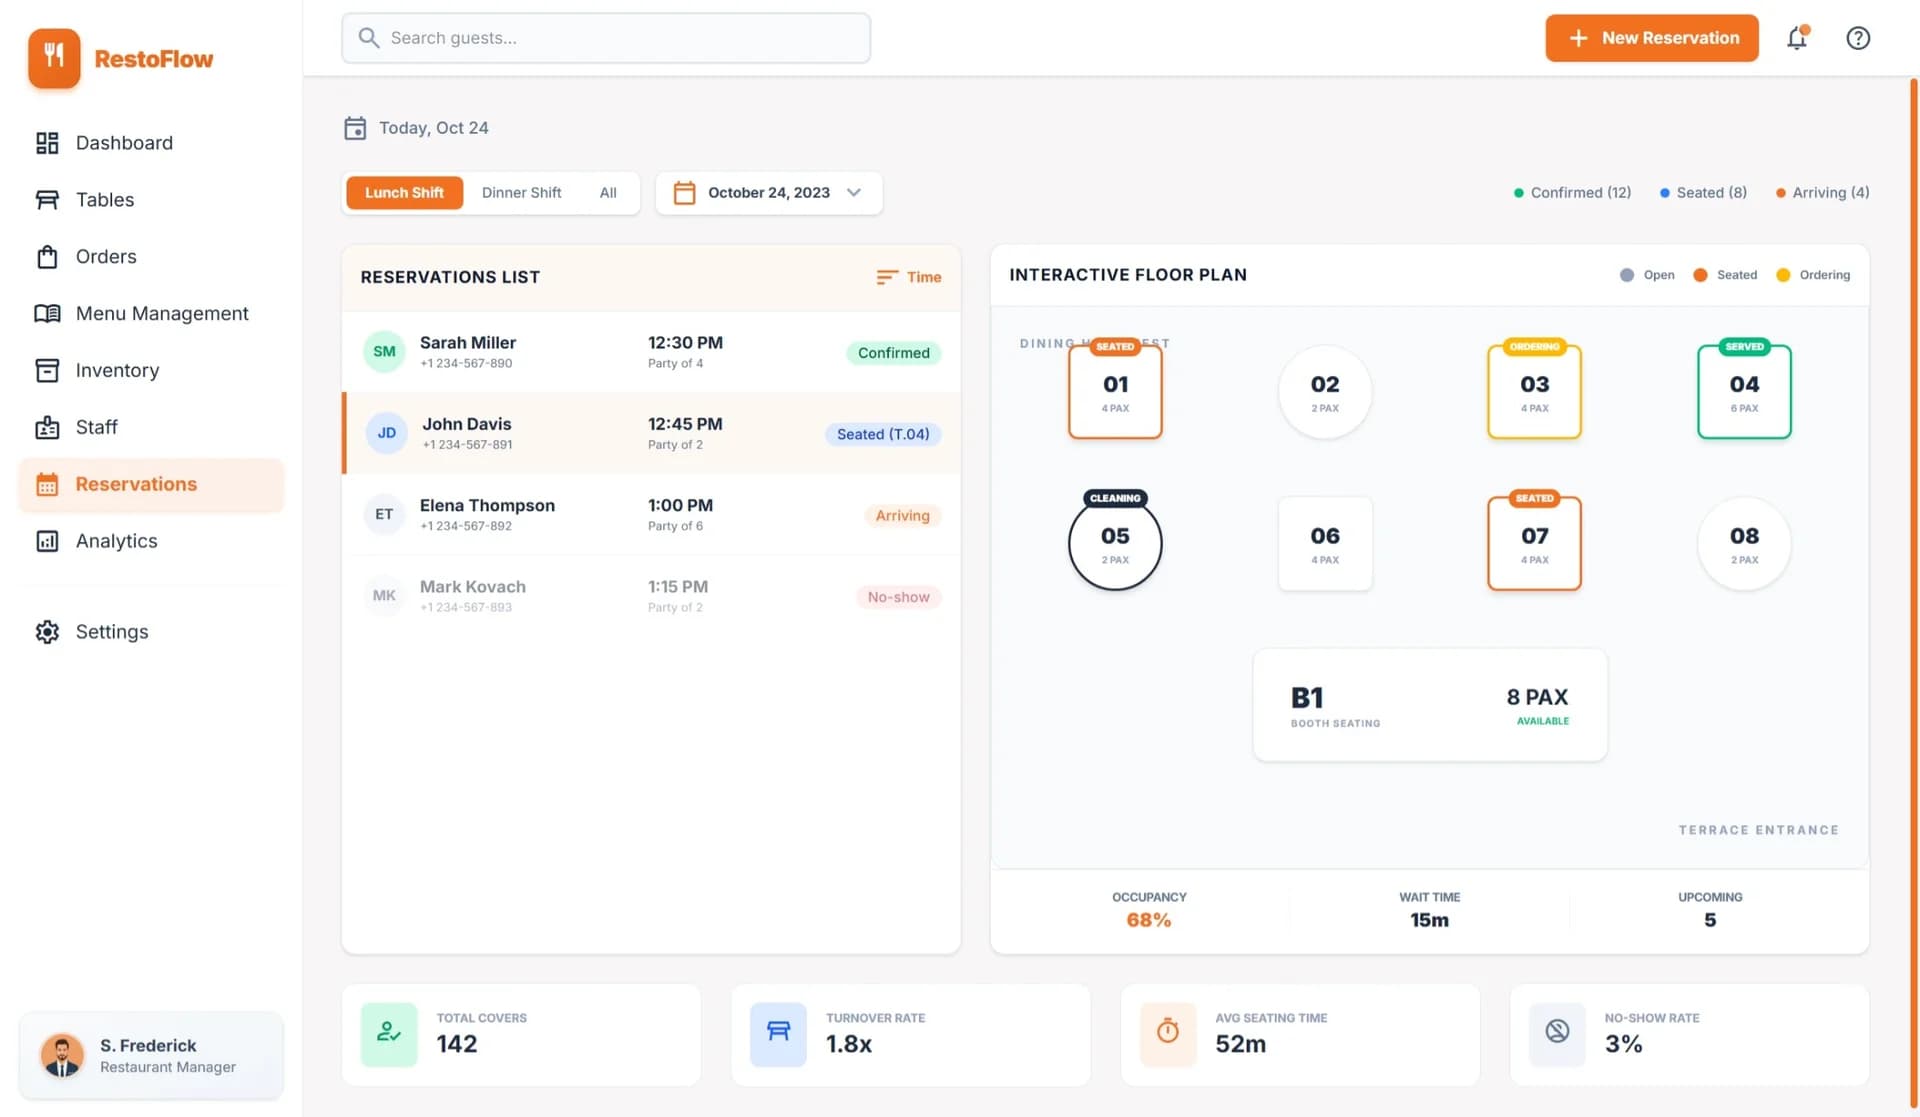
Dynamic Menu Management + Visual Floor Plan Engine + Low-Latency Kitchen Display
5 controlled phases
Chosen for the operating constraint
Measured outcomes 90 days post-launch across pilot locations
Based on Q1 run-rate across 40 locations from reduced waste, labor optimization, and increased throughput
Fragmented Systems Were Bleeding Revenue
Restaurant groups were hemorrhaging revenue through a patchwork of disconnected systems—reservations on one platform, POS on another, kitchen tickets printed on paper, and inventory tracked in spreadsheets. Servers juggled multiple devices while guests waited 12+ minutes just to place an order, and 86'd items continued appearing on digital menus long after the kitchen ran out, triggering frustrating customer complaints and costly comped meals averaging $847 per location monthly. Managers had zero visibility into real-time floor performance, labor costs were misaligned with actual demand patterns, and cross-location reporting required 3-5 days of manual data reconciliation each week. The human toll was equally severe: front-of-house staff experienced 40% higher turnover due to burnout from inefficient workflows, kitchen teams faced constant fire drills from surprise orders, and guests increasingly left negative reviews citing slow service and order errors—directly impacting repeat business and brand reputation.

Where the operation was leaking value
The problem was not one broken screen. It was a chain of small operational delays compounding across every shift.

One Unified
Operations Platform
We architected a comprehensive real-time platform built on Flutter for cross-platform consistency and Firebase for instant synchronization across every touchpoint—from QR code ordering and tablet kiosks to kitchen display systems and manager dashboards. The system orchestrates the complete guest journey with WebSocket-powered live updates, ensuring that when a table is seated, the server is notified instantly; when inventory drops below threshold, menu items automatically adjust; when the kitchen bumps an order, the front-of-house sees it immediately. A sophisticated floor plan engine with drag-and-drop table management, split-bill capabilities, and multi-tender payment processing eliminates the friction that plagued legacy systems, while ingredient-level inventory integration with QR scanning creates a closed loop between what's in stock and what guests can order. The architecture prioritizes operational resilience with offline mode and local caching so restaurants continue taking orders even during internet outages, and every transaction flows through PCI-compliant payment rails with full audit trails for compliance and dispute resolution.
From disconnected work
to one live system.
Fewer handoffs, faster decisions, and one source of truth connecting the teams, devices, and workflows that used to drift apart.
Architecture Built
For the Outcome.
Each technical decision maps to a business constraint: speed, resilience, scale, privacy, or long-term maintainability.
 Cross-Platform
 Real-time DB
 API Runtime


 Orchestration
“We chose Flutter for the front-end to maximize code reuse across customer-facing apps and internal tools, paired with Firebase's real-time capabilities to ensure every table, kitchen station, and manager dashboard sees the same state within milliseconds.”
— Lead Architect, Kreative Tek Solutions
Cross-PlatformReal-time DBAPI RuntimeOrchestration“We chose Flutter for the front-end to maximize code reuse across customer-facing apps and internal tools, paired with Firebase's real-time capabilities to ensure every table, kitchen station, and manager dashboard sees the same state within milliseconds.”
— Lead Architect, Kreative Tek Solutions
Built With Precision
From discovery to deployment in 14 weeks
Discovery & Mapping
Weeks 1–2 DiscoveryArchitecture & UX Design
Weeks 3–5 ArchitectureCore Platform Development
Weeks 6–10 Core BuildIntegration & Testing
Weeks 11–12 TestingDeployment & Rollout
Weeks 13–14 Launch

Results That Move the Needle
Measured outcomes 90 days post-launch across pilot locations


Before vs. After
The unified platform eliminated the fragmented toolchain that was costing the restaurant group millions in inefficiencies. Within 90 days, every key operational metric showed dramatic improvement—from guest satisfaction scores to kitchen throughput—unlocking capacity for higher revenue without additional headcount.
Average Order-to-Serve Time
86'd Item Customer Complaints
Server Time on Admin Tasks
Inventory Shrinkage Rate
Cross-Location Reporting
Verified production metrics from the live engagement. Details withheld where required by NDA.

Ready to Transform Your Restaurant Operations?
Let's build something remarkable together—a platform that delights guests and empowers your team.