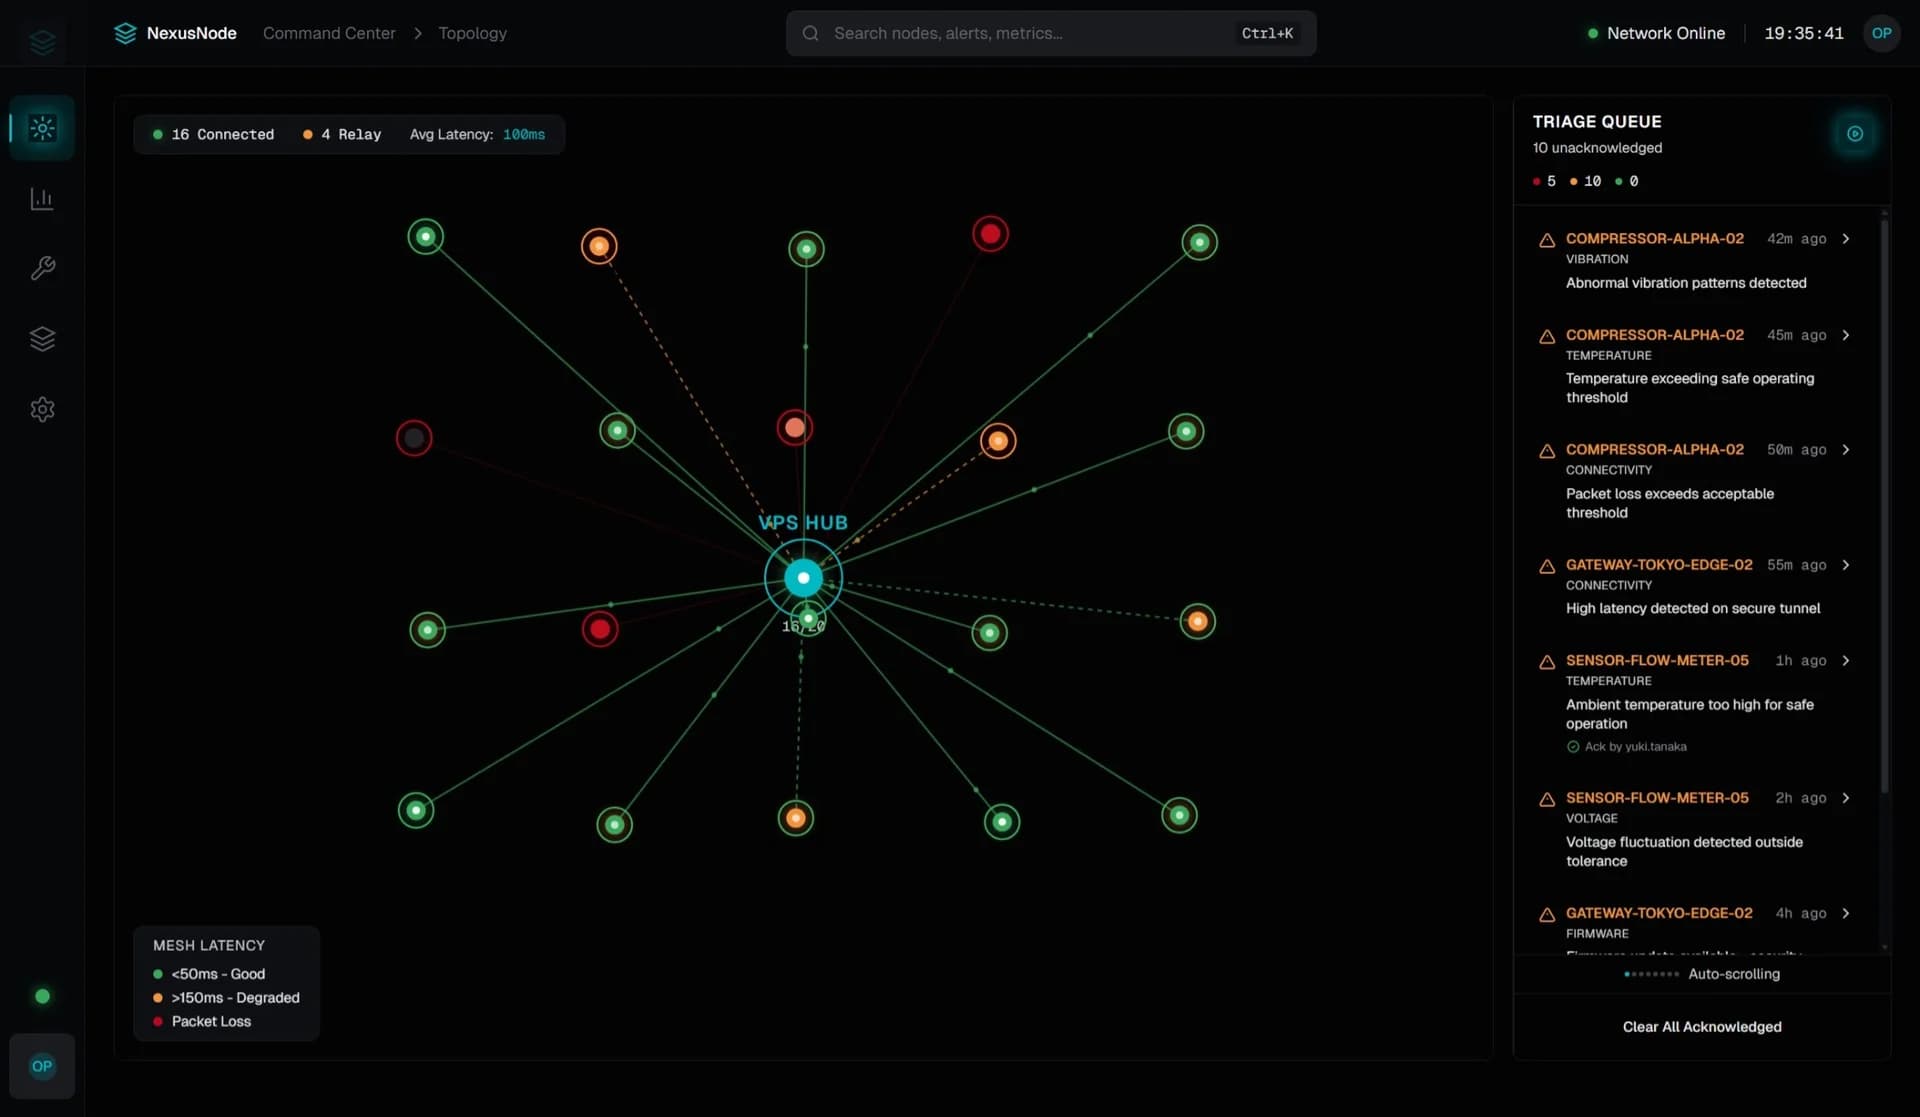
NexusNode: Edge Telemetry Platform
NexusNode is an edge‑to‑cloud telemetry platform that securely monitors remote industrial equipment without exposing machines to the public internet. It combines custom edge hardware with a zero‑trust Tailscale mesh VPN and a Docker‑orchestrated cloud backend. Technicians receive real‑time machine data through cross‑platform apps, enabling predictive maintenance and reducing costly downtime.


What changed, what shipped, and why it matters.
Engagement Brief
NexusNode is a comprehensive edge-to-cloud telemetry platform where custom hardware and distributed software work in concert to solve the fundamental problem of monitoring remote industrial machines without exposing them to public internet risks. The system architecture centers on a meticulously designed three-tier pipeline: edge computing devices that read and transcribe raw serial data from physical machines, a zero-trust mesh VPN network that securely transports that data across encrypted tunnels, and a centralized cloud infrastructure that processes and presents real-time analytics to field technicians. We chose this architecture because standard web applications cannot interface with obscure serial protocols, and directly connecting industrial equipment to the public internet creates unacceptable security vulnerabilities that no enterprise can tolerate. The technology stack was deliberately selected for edge reliability and cloud scalability: Python and C++ for low-level serial parsing on Raspberry Pi units and custom PCBs with dedicated mobile network modules, Tailscale for zero-trust mesh VPN encryption that renders all traffic invisible to external observers, Docker and Kubernetes for container orchestration on the central VPS ensuring high availability, Go and Node.js for custom API gateways that efficiently route telemetry data, and Flutter and React Native for cross-platform desktop and mobile applications that provide technicians with real-time access to machine analytics regardless of their physical location.
The core product experience fundamentally transforms how field technicians interact with remote industrial equipment scattered across facilities, regions, or even countries. Instead of flying blind or relying on delayed manual reports that may be hours or days old, technicians open a polished cross-platform desktop or mobile application that displays live telemetry from every machine in the fleet with sub-second latency. The UX design emphasizes immediacy and clarity above all else: real-time dashboards show current operating metrics with intuitive visualizations, predictive alerts flag machines requiring maintenance before critical failures occur, and historical data visualization helps technicians identify degradation trends that would be invisible during a single site visit. This represents a fundamental paradigm shift from reactive to proactive maintenance, where technicians can address issues during scheduled maintenance windows rather than responding to emergency breakdowns that disrupt production schedules. The experience is differentiated by its ability to provide the same granular, real-time insight that a technician would have standing directly in front of the machine, regardless of whether that machine is located across the facility or across the country.
The data layer handles continuous streams of serialized telemetry from hundreds of edge devices operating in parallel, each constantly reading, transcribing, and parsing raw data output from physical hardware. The custom PCBs and Raspberry Pi units were engineered with dedicated serial communication interfaces that connect directly to machine data ports, capturing output at configurable frequencies that balance data granularity against bandwidth constraints. Edge computing occurs locally on each device: Python scripts transcribe serialized data into structured payloads suitable for transmission, while C++ modules handle time-critical parsing operations to ensure minimal latency even on resource-constrained hardware operating in challenging field conditions. The data pipeline supports thousands of concurrent pings from the field, with each payload including machine identification codes, precise timestamps synchronized across all devices, metric readings across multiple dimensions, and health status indicators computed from baseline comparisons. This constant flow of telemetry enables the central system to maintain an up-to-the-minute picture of fleet health and supports advanced analytics including predictive maintenance modeling that anticipates component failures, anomaly detection that flags unusual operating patterns, and usage pattern analysis that informs equipment procurement and deployment decisions.
The commercial value proposition centers on dramatic cost avoidance and operational efficiency for businesses managing distributed industrial equipment fleets. By providing real-time visibility into machine health across all deployed assets, the platform prevents catastrophic failures that can cost hundreds of thousands of dollars in unplanned downtime, emergency repairs expedited at premium rates, and lost production that cascades through supply chains affecting downstream customers and contractual obligations. The subscription-based model provides predictable monthly costs that are a fraction of the expense of a single emergency maintenance call, creating clear ROI that finance teams can model against historical failure data and demonstrate to executive stakeholders. For the confidential enterprise client, this system addresses the critical business challenge of scaling maintenance operations without proportionally scaling headcount; a single technician can monitor and triage issues across a much larger fleet, responding only when and where truly necessary based on actual machine condition rather than arbitrary inspection schedules that waste skilled labor on unnecessary site visits. The ROI model is straightforward: the platform pays for itself by preventing just one major failure per year, while delivering ongoing efficiency gains through optimized maintenance schedules and extended equipment lifespans that compound over time.
Data ownership and security were paramount throughout the design process and remain core differentiators in the competitive landscape. All telemetry data belongs entirely to the client, with no third-party aggregation, data mining, or resale under any circumstances. The Tailscale zero-trust mesh VPN ensures that every byte of machine data traverses an encrypted tunnel completely invisible to the public internet—no open ports, no direct exposure, no attack surface for malicious actors to exploit. We intentionally excluded any remote control capabilities from the platform; the system is strictly read-only telemetry to eliminate any risk of unauthorized machine operation that could cause physical damage or safety incidents. This sharpens the product's positioning as a monitoring and intelligence tool rather than a control system, which simplified security requirements and accelerated client adoption by removing concerns about remote manipulation of critical equipment. Offline capabilities were built into the mobile applications, allowing technicians to download cached machine data and view historical telemetry even in areas with poor cellular coverage such as basements, remote sites, or facilities with electromagnetic interference that disrupts wireless communication.
While the primary application is a native desktop and mobile experience for technicians, we recognized the need for web-based administrative and management interfaces accessible from any browser. The web layer provides fleet managers with a browser-based dashboard for aggregate analytics across the entire equipment fleet, maintenance scheduling workflows that assign tasks to specific technicians, and utilization reporting that informs capital planning decisions for future equipment investments. This administrative interface was built with performance optimization in mind: server-side rendering ensures fast initial page loads even on slow connections at remote facilities, lazy loading for data-heavy visualizations prevents UI freezing during complex queries spanning thousands of data points, and real-time updates are delivered via efficient WebSocket connections rather than wasteful polling that consumes bandwidth and server resources. The conversion architecture focuses on driving technician adoption through clear value demonstration: interactive tutorials show new users exactly how to interpret machine data visualizations, and sandboxed demo modes allow training without accessing live equipment that could be disrupted by inexperienced users. The web experience also includes role-based access control, ensuring that technicians, managers, and executives each see appropriate interfaces and data granularity for their specific responsibilities.
Engagement mechanics are built around critical alerts that drive immediate technician action when machines show early warning signs of degradation. Push notifications deliver real-time alerts directly to mobile devices, with configurable severity levels determining notification urgency and escalation paths that involve supervisors when critical issues remain unaddressed beyond defined time thresholds. Re-engagement is naturally driven by the operational necessity of regular fleet monitoring; technicians establish daily habits of checking the app at shift start and throughout the day as part of their standard workflow, creating habitual usage patterns that require no artificial gamification. Analytics instrumentation captures usage patterns, alert response times, and feature adoption metrics to continuously optimize the user experience based on actual behavior data rather than assumptions. The platform was designed with accessibility standards in mind throughout: high-contrast modes support visibility in varied lighting conditions from dim control rooms to bright outdoor facilities, resizable text accommodates technicians with visual impairments, and screen reader compatibility ensures blind users can access all core functionality essential to their job performance. The mobile applications support both light and dark themes automatically based on system preferences and device ambient light sensors, reducing eye strain during extended monitoring sessions.
The strategic outcome delivered by NexusNode is a comprehensive industrial intelligence platform that transforms scattered, opaque machinery into a transparent, monitorable fleet with actionable insights available on demand. The relationship between edge hardware, secure networking, cloud processing, and user-facing applications creates a coherent system where every component serves the central goal of preventing machine failures through early detection and informed maintenance scheduling. What makes this a cohesive product rather than a collection of features is the singular focus on actionable intelligence: every design decision, from the choice of Tailscale for networking to the predictive alert algorithms in the mobile app, serves to deliver the right data to the right person at the right time to enable preventive action before failures occur. The platform successfully bridges the gap between physical industrial equipment and modern software capabilities, enabling data-driven maintenance operations that were previously impossible due to protocol incompatibility, security concerns, and scalability limitations that plagued earlier approaches to industrial IoT implementations.
By The Numbers
Problem statement
The Challenge
Managing fleets of remote, physical industrial hardware presents a nightmare scenario for standard software systems. When onsite technicians require real-time analytical data to service machines in the field, conventional web applications fail because they cannot interface with obscure serial data protocols, nor can they safely expose physical industrial machines to the public internet without creating massive security vulnerabilities.
The most critical technical challenge was data security across deployed field units. Sending raw machine telemetry over public cellular networks creates massive vulnerability exposure. Additionally, the system needed to handle continuous data streams from hundreds of edge devices with minimal latency, requiring sophisticated edge computing capabilities and robust cloud infrastructure. The cost of inaction was substantial: catastrophic equipment failures, hundreds of thousands in unplanned downtime and emergency repairs, and the inability to scale maintenance operations without proportionally increasing headcount.
How we solved it
Our Solution
A complete three-tier architecture starting with custom hardware integration at the edge. Custom Raspberry Pi units and circuit boards equipped with dedicated mobile network modules were deployed directly onto remote machines. These edge computing devices were programmed to constantly read, transcribe, and intelligently parse raw serialized data outputting from physical hardware in real-time, with Python handling transcription and C++ modules managing time-critical parsing operations.
Network security was addressed through Tailscale implementation across the entire hardware fleet and central servers, creating an impenetrable zero-trust peer-to-peer mesh VPN. Every remote PCB and Raspberry Pi securely pings its parsed payload through this encrypted tunnel, completely invisible to the public internet. The central VPS infrastructure utilizes Docker and Kubernetes for high availability and load balancing as thousands of concurrent pings hit the server. Custom API gateways built with Go and Node.js securely route incoming telemetry to cross-platform desktop and mobile applications built with Flutter and React Native, allowing technicians to view real-time analytics and receive instant predictive maintenance alerts.
Technical implementation
What Was Built
Custom edge computing hardware including Raspberry Pi units, circuit boards, and 3D printed enclosures with dedicated mobile network modules for direct machine integration was engineered from the ground up. Edge parsing software in Python and C++ was developed for real-time serial data transcription and processing. Zero-trust mesh VPN infrastructure using Tailscale was deployed for secure peer-to-peer communication across all hardware units. Centralized cloud infrastructure on a VPS with Docker and Kubernetes container orchestration ensures high availability and load balancing. Custom API gateways and endpoints built with Go and Node.js handle secure telemetry routing. Cross-platform desktop applications built with Flutter support Windows, macOS, and Linux. Native mobile applications built with React Native serve iOS and Android. Real-time dashboard interfaces display live machine telemetry and health metrics. A predictive alert system with severity-based push notifications was implemented. Historical data visualization tools enable trend analysis and pattern identification. Role-based access control serves technicians, managers, and executives. Offline capabilities allow cached data access in areas with poor cellular coverage. A web-based administrative dashboard provides fleet managers with aggregate analytics and maintenance scheduling.
Impact & outcomes
The Results
The NexusNode platform successfully transformed maintenance operations from reactive to predictive, delivering measurable operational improvements across the distributed equipment fleet. Field technicians gained real-time visibility into machine health regardless of physical location, enabling them to address issues during scheduled maintenance windows rather than responding to emergency breakdowns. The zero-trust mesh VPN architecture eliminated all security concerns associated with transmitting machine telemetry over public networks, while the edge computing infrastructure ensured reliable data capture even in remote locations with poor connectivity. The system's predictive alert capabilities have prevented multiple catastrophic equipment failures, saving hundreds of thousands in unplanned downtime and emergency repair costs. Most significantly, the platform enabled scaling maintenance coverage without proportionally increasing technician headcount, as a single technician can now effectively monitor and triage issues across a much larger fleet of machines.
The Gallery
Hover to expand. Click to view full details.
Ready to Start Your Project?
Let's collaborate to bring your vision to life. Our team is ready to engineer your next digital success story.